
How Much Money Do You Really Need to Retire?
A practical guide to retirement savings, pensions, and withdrawal rates in three steps: estimate your spending, subtract pension income, and stress-test the gap, with a worked example and real calculator screenshots.
This article was submitted by a member. Views and content are the author’s own and do not represent this site.
Start here — 2 minutes: Open the retirement planning calculator and enter just 4 numbers: your monthly spending, your expected monthly pension, your current savings, and your planned retirement age. You will see your income gap first, then your target. Open the retirement planning calculator
By Time Traveler Lab — Practical retirement-planning guides.
Who this is for: anyone who wants a retirement number they can explain, not just a headline number. If you already have a pension estimate, start at Section 4. If you are starting from zero, start at Section 1 and work through the 3-budget exercise.
What you will leave with: Your essential budget, your lifestyle budget, your annual income gap after pensions, a portfolio target range under 3 withdrawal rates, and a one-page annual review checklist you can repeat every year.
Introduction: Retirement Is Not Just About Reaching a Savings Number
How much money do you need to retire? It is one of the most important financial questions you can ask, yet it is easy to answer incorrectly. You may have seen headlines suggesting that you need $1 million, $1.5 million, or even $2 million. Those headlines skip the three things that actually decide the answer: how much you will spend, how much pension income you will have, and how long the money must last.
A homeowner with a reliable public pension and modest expenses may need a very different portfolio from a renter with no guaranteed pension and substantial healthcare costs. Two people with identical savings can have different outcomes, because their spending, pensions, taxes, health, and household situations differ.
The useful question is not simply how large your retirement account should be. It is whether your total retirement income can support the life you want for as long as you may need it, while allowing for inflation, market declines, healthcare costs, and the possibility that one partner lives much longer than the other.
This guide uses general planning principles for global readers. Social Security, 401(k) plans, Traditional IRAs, Roth IRAs, and Medicare are discussed only as United States examples. Rules in other countries differ and must be checked locally. Nothing here is a personal benefit quote, a tax filing position, or investment advice.
How to use this guide: Do the exercises in order the first time: budget (Section 1) → future spending (Section 2) → pension income (Section 3) → income gap (Section 4) → target (Section 8) → stress test (Section 15). Then use the calculator in Section 16 to compare scenarios. The worked example in Section 20 shows every step with one household, so you can check your own math against it.
1. Start With the Retirement Life You Actually Want
Salary is not the same as retirement spending. Begin by estimating the life you expect to live after leaving full-time work. Separate essential expenses from discretionary expenses, because they behave differently when markets fall: essentials must be funded in every scenario, discretionary spending can be paused.
Essential expenses may include housing, food, utilities, transportation, insurance, healthcare, taxes, and support for family members. Discretionary expenses may include travel, restaurants, hobbies, entertainment, gifts, and optional purchases. Write both lists in today's dollars first. Do not try to forecast 20 years of inflation before you know what you spend today.
A hypothetical household might estimate monthly expenses of $1,200 for housing and maintenance, $700 for food, $250 for utilities and communication, $350 for transportation, $500 for healthcare and insurance, $300 for taxes and obligations, and $900 for travel, hobbies, and gifts — about $4,200 per month, or $50,400 per year. These figures are illustrative only. Local prices, household size, housing arrangements, and healthcare systems can change the result substantially.
Do not assume that home ownership eliminates housing costs. Property taxes, insurance, maintenance, repairs, and renovations remain. Likewise, retirement does not always mean spending less: commuting may disappear while travel, healthcare, and helping family members may rise. Some households spend more in the first years of retirement, then less, then more again when care needs grow.
Build at least three budgets: essential spending, expected lifestyle spending, and a higher-cost scenario. Also include irregular expenses such as vehicle replacement, dental treatment, home repairs, moving costs, and emergency travel. A large irregular cost that arrives in a bad market year hurts more than the same cost in a good year, so list it now rather than discovering it later.
| Budget | What it covers | When to use it |
|---|---|---|
| Essential | Housing, food, utilities, transport, insurance, healthcare, taxes | Every stress test must pass this budget |
| Expected lifestyle | Essentials + travel, hobbies, dining, gifts | Your base plan — the number you plan around |
| Higher-cost | Lifestyle + one large irregular cost per year | Your safety margin — test this too |
Try it now: Write your three monthly totals in today's dollars. If you cannot, use last year's bank and card statements for 30 minutes and total them by category. That one exercise is worth more than any headline retirement number.
2. Convert Today's Expenses Into Future Spending
Inflation reduces purchasing power. The future value of an expense can be estimated as: Future Expense = Current Expense × (1 + Inflation Rate) ^ Number of Years.
If annual spending is $50,400 and inflation averages 2.5% for 20 years, the future amount is about $82,586. This is a planning illustration, not a forecast. At 2% inflation, the same budget would grow to about $74,892; at 3%, about $91,028; and at 4%, about $110,433. Small differences in assumptions compound over long periods, which is why this guide tests more than one inflation rate instead of trusting a single forecast.
The chart below shows how the same retirement budget can require very different future spending amounts when inflation assumptions change. The gap between the lines widens over time because inflation compounds.
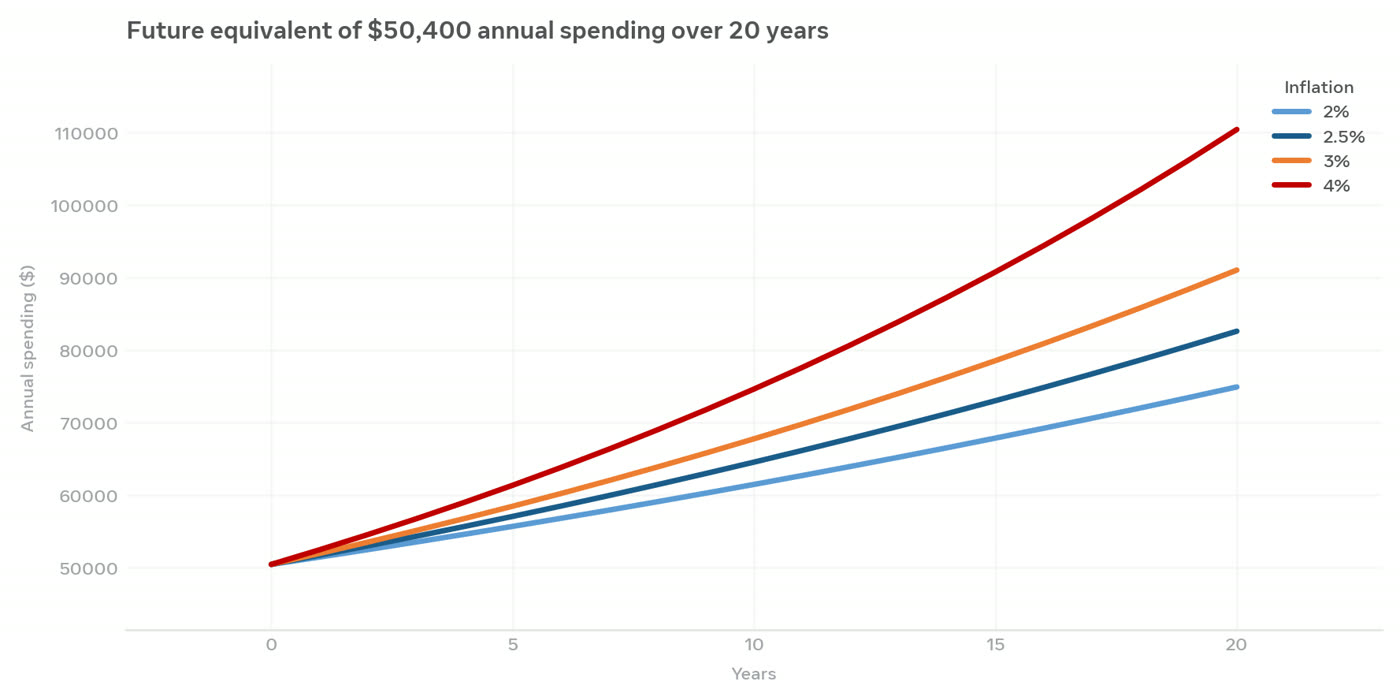
Figure 2 — Future equivalent of $50,400 annual spending over 20 years at 2%, 2.5%, 3%, and 4% inflation. Illustrative only.
Personal inflation may differ from headline inflation. Housing, healthcare, food, energy, and transportation do not necessarily rise at the same rate. Healthcare and long-term care deserve special attention because they may become a larger share of spending as you age, and because their price growth has often exceeded general inflation.
Use consistent units when modelling returns and expenses. You can project future nominal expenses and compare them with nominal returns, or express everything in today's purchasing power and use real returns. Do not mix today's dollars with future dollars in the same calculation — that is the most common way a retirement plan quietly understates the target.
A useful real-return relationship is: Real Return = (1 + Nominal Return) ÷ (1 + Inflation) − 1. If a portfolio earns 6% before fees and inflation is 2.5%, the real return before fees is approximately 3.41%. Fees reduce it further. Consider fund expense ratios, advisory fees, account charges, trading costs, taxes, and currency conversion costs, because each one compounds against you over decades.
Not every pension or annuity automatically keeps pace with inflation. Check whether adjustments are linked to consumer prices, wages, capped increases, or another formula. A fixed nominal payment can lose substantial purchasing power over a 25-year retirement, even when the starting amount looks adequate.
3. Identify Your Retirement Income Sources
Most retirement plans combine public pensions, employer-sponsored arrangements, and personal savings. Their names, eligibility rules, tax treatment, and payment structures vary by country. List each source separately, with its start age, its estimated monthly amount, and whether it is inflation-adjusted.
Public pensions may depend on employment contributions, years of residence, earnings history, income testing, or a combination. Do not assume a public pension replaces a fixed percentage of salary. Check the official estimate, eligibility age, and any reduction for early claiming or increase for delayed claiming.
Employer plans may be defined benefit or defined contribution. A defined benefit plan uses a formula, often based on salary and years of service. A defined contribution plan accumulates contributions and investment returns in an account; the retirement income it can support depends on the balance, the withdrawal method, and how long it must last.
Personal savings may include bank deposits, brokerage accounts, funds, bonds, retirement accounts, and investment property. Separate investable assets from non-liquid assets. A home you intend to live in has value, but it does not automatically produce monthly income unless you sell, downsize, or borrow against it — each of which has costs and risks.
- Public pension — official estimate, start age, inflation adjustment?
- Employer pension or annuity — fixed or inflation-linked, single or joint life?
- Personal savings and retirement accounts — balance, tax type, withdrawal rules?
- Other income — part-time work, rental income, royalties, family support? Only count what is reliable.
4. Calculate the Annual Income Gap
Your portfolio may not need to fund all retirement spending. First subtract expected pension income from expected expenses: Annual Income Gap = Annual Retirement Spending − Annual Reliable Pension Income.
Suppose annual spending is $50,400, public pension income is $18,000, and an employer pension provides $6,000. Total pension income is $24,000, leaving an annual portfolio gap of $26,400 before taxes, fees, and irregular expenses. That gap — not total spending — is what your portfolio must cover. This one subtraction is why two households with the same spending can need very different portfolios.
Use net, spendable income where possible. Gross pension payments and gross withdrawals are not the same as money available for daily expenses. Tax treatment differs across countries and account types. Estimate taxes and mandatory deductions before you call a plan 'fully funded.'
Treat uncertain benefits conservatively. An estimate may depend on future earnings, current legislation, claiming age, or eligibility conditions. If a benefit is uncertain, test a lower-benefit scenario rather than relying on the most optimistic estimate. Section 15 shows how to stress-test this in one pass.
Try it now: Annual spending − annual reliable pension = your annual income gap. Enter that gap into the calculator as the number your portfolio must fund. Open the retirement planning calculator
5. United States Example: Social Security
Social Security is a United States public retirement program, not a personal investment account. Benefits are based on an individual's earnings record and program rules. Claiming age affects the monthly amount, and the choice is permanent in most cases, so it deserves a deliberate comparison rather than a default.
For people born in 1960 or later, full retirement age is 67. Eligible workers may claim as early as 62, but early claiming permanently reduces the monthly benefit. For this birth group, claiming at 62 generally produces 70% of the full retirement benefit, and delaying to 70 generally produces 124% of it.
For illustration, if a worker's estimated full retirement benefit at 67 were $2,000 per month, the approximate amounts would be $1,400 at 62, $2,000 at 67, and $2,480 at 70. This is a simplified illustration, not a personal benefit quote. Your actual amounts depend on your earnings record, birth year, and claiming history.
The decision is not simply about maximizing the monthly amount. Earlier claiming provides payments for more years; delaying requires other income or savings to cover the waiting period. Consider health, household income, spouse and survivor benefits, tax brackets, and whether you can afford to wait without depleting savings in a way that creates a larger risk later.
Review your official earnings record and benefit estimates through the Social Security Administration. Future earnings may change the estimate. Social Security cost-of-living adjustments also do not necessarily match your personal inflation, especially if healthcare is a large share of your spending.
Section 22 compares monthly benefit versus lifetime benefit in detail, including the break-even age and the survivor-benefit reason many couples choose different claiming ages for each partner.
6. United States Example: 401(k), Traditional IRA, and Roth IRA
A 401(k) is an employer-sponsored defined contribution plan. Employees contribute salary subject to plan rules and annual limits; employers may provide matching contributions. Review vesting, investment choices, administrative fees, expense ratios, and the withdrawal rules that will apply in retirement.
For 2026, the general employee elective deferral limit for most 401(k) plans is $24,500. Eligible older participants may have additional catch-up contributions under applicable rules. Confirm current limits with the IRS and your plan administrator before you rely on them, because limits change with cost-of-living adjustments.
Traditional IRA contributions may be deductible depending on eligibility and circumstances. Investment growth is generally tax-deferred, and withdrawals are generally taxable. Consider deduction eligibility, future tax rates, required minimum distributions, and how withdrawals interact with other income.
Roth IRA contributions are generally made with after-tax money, while qualified withdrawals can be tax-free. Eligibility and contribution limits depend on income and filing status. A Roth account can provide tax diversification, but it is not automatically better for every household — the comparison depends on today's tax rate versus the expected rate in retirement.
For 2026, the combined annual contribution limit for Traditional and Roth IRAs is generally $7,500. Eligible individuals aged 50 or older may contribute an additional $1,100, for a total of $8,600. This is a combined limit, not a separate limit for each account type.
Account balances should not simply be added together as if every dollar had identical after-tax value. Estimate the tax treatment of each account, expected withdrawal sequence, required distributions, taxable pension income, and possible effects on Medicare premiums and taxation of Social Security benefits. Section 23 works through this with a concrete example.
7. Healthcare and Long-Term Care
Healthcare is a major retirement variable. Coverage differs by country and may depend on employment, income, residency, insurance choices, and eligibility. Do not assume that reaching a particular age makes all healthcare free.
In the United States, Medicare is important for many retirees, but it does not eliminate healthcare costs. Premiums, deductibles, coinsurance, prescription drug coverage, supplemental insurance, and out-of-pocket expenses all matter. Budget the total cost of coverage, not just the headline premium.
Medicare generally does not pay for long-term custodial care, such as ongoing help with bathing, dressing, eating, or moving around. Consider home care, community services, residential facilities, and possible support from family. Long-term care is the expense most likely to break an otherwise adequate plan, because it can arrive suddenly, last years, and cost far more than routine medical care.
- What coverage will I have on day one after leaving work, and what does it cost per month?
- What are my deductibles, copays, drug costs, and out-of-pocket maximums?
- If I need help with daily activities for 2 years, who provides it and what does it cost?
- If one partner needs care and the other does not, how does the household budget change?
8. Estimate Your Retirement Portfolio Target
Once you know the annual income gap, you can estimate a portfolio target. The simplest planning shortcut is: Portfolio Target ≈ Annual Income Gap ÷ Withdrawal Rate. The withdrawal rate is not a guarantee — it is an assumption you must test. Section 9 explains where the 4% figure comes from and why it is not a promise.
For the household in Section 4, with a $26,400 annual gap, the targets are: at a 4% initial withdrawal rate, about $660,000; at 3.5%, about $754,000; at 3%, about $880,000. The same household, the same spending, the same pension — three very different targets, depending only on how cautious the withdrawal assumption is. That range is the point: your target is a range, not a single magic number.
| Annual income gap | At 4% withdrawal | At 3.5% withdrawal | At 3% withdrawal |
|---|---|---|---|
| $20,000 | $500,000 | $571,000 | $667,000 |
| $26,400 (worked example) | $660,000 | $754,000 | $880,000 |
| $35,000 | $875,000 | $1,000,000 | $1,167,000 |
| $50,000 | $1,250,000 | $1,429,000 | $1,667,000 |
The chart below compares the portfolio needed to fund the same annual income gap at three different starting withdrawal rates. A lower withdrawal rate requires a larger starting portfolio.
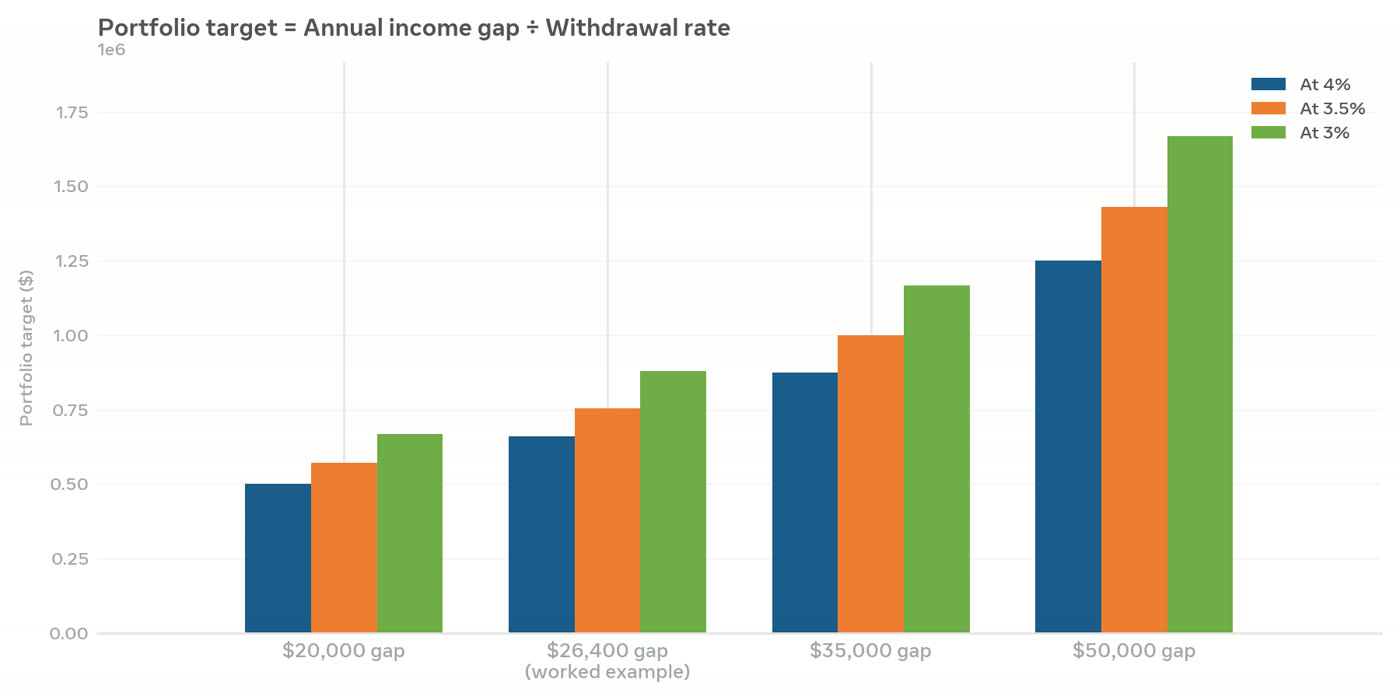
Figure 3 — Portfolio target = Annual income gap ÷ Withdrawal rate, for gaps of $20,000, $26,400, $35,000, and $50,000. Illustrative only.
These targets exclude taxes, fees, and irregular expenses unless you included them in the gap. If you did not, add them before you call the target final. A target that ignores taxes is not conservative — it is incomplete.
9. Understand the 4% Rule
The 4% rule comes from research on historical US market sequences: a retiree who withdrew 4% of the initial portfolio in year one, then adjusted that amount for inflation each year, historically did not run out of money over 30-year periods in the studied scenarios. It is a research finding about the past, not a guarantee about your future.
Three conditions make the 4% figure less reliable than it sounds. First, it was studied for a specific stock-and-bond mix and a 30-year horizon; a longer retirement, a different mix, or a different country changes the result. Second, it assumes rigid inflation-adjusted withdrawals even in bad markets, which few households actually follow. Third, it ignores taxes, fees, and the sequence of returns — a sharp fall in the first years hurts far more than the same fall 15 years in.
Use the 4% rule as a planning shortcut to compare scenarios, then test 3% and 3.5% as well. If your plan only works at 4% or higher, it is fragile. If it works at 3%, it has margin. That margin is what lets you keep spending on essentials in a bad market without panic-selling.
For longer retirements — retiring at 55 or 60, or a household where one partner may live to 95 — a lower initial withdrawal rate, a flexible withdrawal method, or a larger portfolio is worth testing explicitly. Section 13 covers longevity, and Section 10 compares flexible methods.
10. Compare Withdrawal Strategies
A fixed inflation-adjusted withdrawal is simple but rigid. A percentage-of-portfolio withdrawal never runs out, but income falls in bad years. A guardrails method — spend a base amount, cut back when the portfolio falls below a threshold, spend a little more when it rises — sits in between. There is no universally best method; there is a method that matches your essential-versus-discretionary split.
| Method | How it works | Best for |
|---|---|---|
| Fixed + inflation | Same real spending every year | Households with mostly essential spending |
| % of portfolio | Withdraw a fixed % of current balance | Households that can accept variable income |
| Guardrails / flexible | Base spending + cuts in bad years, raises in good years | Most households — protects essentials, flexes lifestyle |
| Bucket / time-segmented | Near-term cash + medium-term bonds + long-term growth | Households that want a visible cash cushion |
The practical rule: fund essentials from reliable income (pension + a conservative withdrawal), and fund discretionary spending from the flexible part. When markets fall, you cut travel and gifts, not food and housing. That separation is what makes a flexible method livable, not just mathematically better.
11. Check Whether Current Savings Are on Track
You do not need a perfect forecast to know whether you are roughly on track. Compare three numbers: what you have now, what you are adding each year, and what your target range requires by your planned retirement age. If the gap is large, the levers are: save more, retire later, spend less, or some combination — and the earlier you choose, the smaller each lever needs to be.
A simple check: project your current savings forward at a conservative real return (for example 3% after inflation and fees), add future contributions at the same real return, and compare the result with the target range from Section 8. If the projection lands below the range, you have a gap to close. If it lands inside the range, you have a plan to protect.
Do not judge progress by account balance alone. A $500,000 balance is 'on track' for a household with a $20,000 gap and 'far behind' for a household with a $50,000 gap. The gap, not the balance, is the yardstick.
Try it now: Enter your current savings, annual contribution, and target into the calculator and test two retirement ages — your planned age and two years later. The difference is often larger than a year of extra saving. Open the retirement planning calculator
12. If You Are Starting Late
Starting late is common, and it is not a reason to give up or to gamble. The most powerful levers are still available: increase the savings rate, capture any employer match, reduce high-interest debt, delay retirement by even one or two years, and make the spending estimate honest rather than optimistic.
Avoid the two traps of late starting. The first is chasing returns with concentrated bets or leverage to 'catch up' — a large loss late in your career hurts more than a modest gain helps. The second is assuming a pension or inheritance will close the gap without an official estimate or a signed document. Plan on what you can verify; treat anything else as upside.
If you are within five years of retirement, the annual review in Section 27 matters more than the long-term projection. You are close enough that pension estimates, healthcare costs, and tax brackets can be checked with real numbers rather than assumptions.
13. Longevity and Household Risk
Retirement planning fails most often not because the average is wrong, but because the tail is ignored. Plan for a longer life than the average, because half of retirees will live longer than average. If you are a couple, plan for the longer of the two lives, not the average of them.
Test a longer-life scenario explicitly: what happens if the plan must last to age 95? What happens if one partner dies first and household income falls (for example, one Social Security benefit disappears) while housing costs stay almost the same? These are not pessimistic scenarios — they are the scenarios that actually happen to many households.
Longevity risk is also why guaranteed income (pension, annuity) and flexible spending matter. A portfolio alone must stretch; a mix of guaranteed income for essentials plus a portfolio for lifestyle spending is easier to sustain over a long horizon.
14. Currency Risk for Cross-Border Retirees
If you retire in a different country from where you earned or hold your savings, currency risk is a real expense. A pension paid in one currency and spent in another can lose purchasing power when exchange rates move, even if both amounts look stable in their own currencies.
Mitigations include: holding some assets in the currency you will spend, matching the currency of reliable income to the currency of essential spending where possible, avoiding large one-way conversions at a single date, and budgeting a currency buffer. A retirement calculator that does not model currency or cross-border tax treatment does not fully represent a cross-border plan — treat its output as partial, not final.
Cross-border tax treatment can be particularly important. A pension paid by one country to a resident of another may be treated differently depending on domestic law and any applicable tax treaty. Check both countries' rules before you assume a pension is tax-free or fully taxable.
15. Stress-Test the Plan
A plan that only works when every assumption is favorable is not a plan — it is a hope. Test at least five shocks, one at a time and then in combination:
- Markets fall 30% in the first 3 years of retirement (sequence risk).
- Inflation runs at 4% instead of 2.5% for a decade.
- Pension income is 20% lower than estimated.
- Healthcare or long-term care costs add $15,000 per year for 3 years.
- The plan must last 5 years longer than expected.
For each shock, write down the adjustment you would actually make: cut discretionary spending by how much, delay retirement by how long, downsize or relocate, take part-time work, or draw on a cash reserve. A stress test without a pre-committed adjustment is just worry. A stress test with an adjustment is a plan.
Try it now: Run the stress test in the calculator: change one assumption at a time and note which one breaks your plan first. That assumption is the one to investigate with real numbers. Open the retirement planning calculator
16. Use a Retirement Calculator to Compare Scenarios
A calculator is useful because retirement variables interact. Changing retirement age affects contribution years and withdrawal years. Inflation changes future spending. Pension timing changes the portfolio gap. Fees reduce returns. Withdrawal methods affect future balances. No single formula shows all of that at once; a calculator lets you see the interactions.
No calculator can know the future. Results are estimates based on entered information. If a tool does not include your country's pension, tax, healthcare, or currency rules, do not assume it fully represents your circumstances. A projection is not an official benefit determination, a tax filing, or investment advice.
16.1 What to enter first
Start with a simple baseline: current age, planned retirement age, current assets, expected annual contributions, annual retirement spending, inflation assumption, and investment assumption. Do not try to solve every question in one session. The most valuable first result is often the gap between expected spending and estimated reliable income. Once that gap is visible, you can decide which assumption to investigate next.
16.2 How to compare scenarios
Change one variable at a time: retire at 65 versus 67; spend $50,400 versus $45,000; assume 2.5% versus 3.5% inflation; assume a 4% versus 3.5% withdrawal rate. Note the target for each scenario. The variable that moves the target most is the variable that deserves the most real-world checking.
16.3 What the calculator cannot decide
A calculator cannot decide whether you should retire, select an investment for you, make a pension estimate legally binding, or determine the right tax strategy. It cannot predict your lifespan, future legislation, medical needs, or market returns. Use it to compare scenarios; use official records and qualified advice for decisions that require personal or legal judgment.

Screenshot 1 — Step 1 of the calculator ("Basics"): current age 52, planned retirement age 67, life expectancy 95, planning country United States.
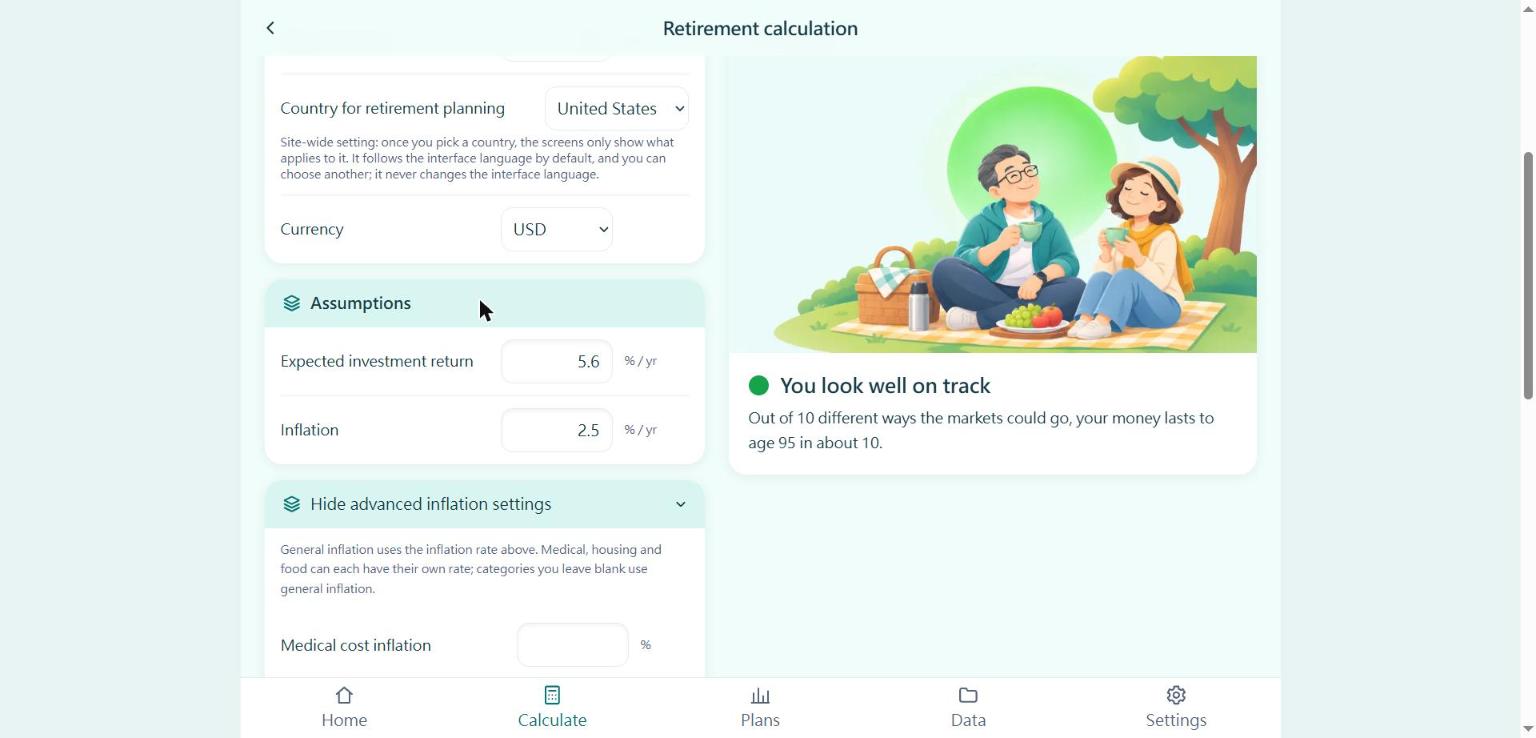
Screenshot 2 — Assumptions on the same step: expected investment return 5.6% and inflation 2.5% per year (about 3% real). Category-specific inflation rates were cleared so the general rate applies.
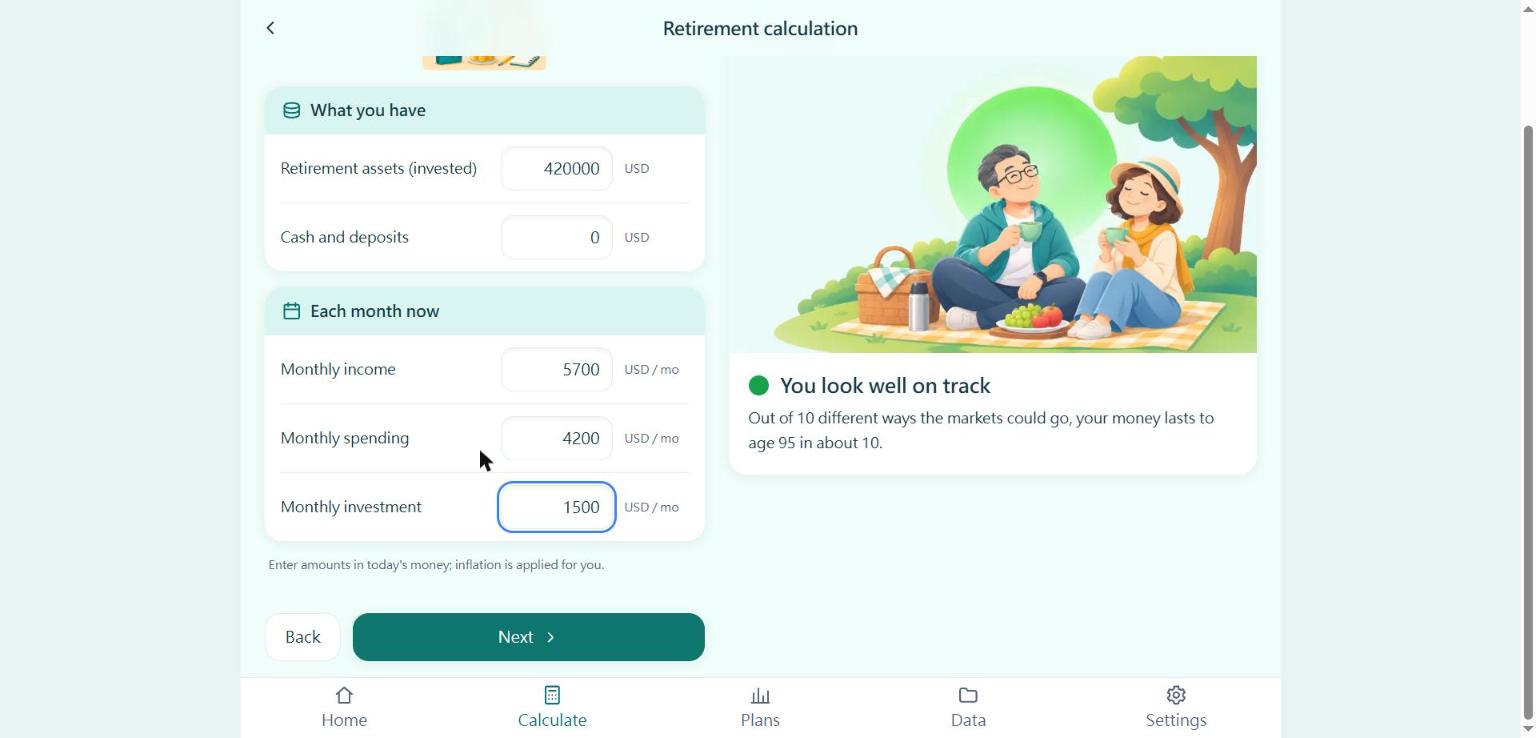
Screenshot 3 — Step 2 ("Assets & cash flow"): $420,000 invested, $4,200 monthly spending, $1,500 monthly investment ($18,000 a year). Monthly income is set to $5,700 only so that income equals spending plus saving; it is not part of the worked example.

Screenshot 4 — Step 3 ("Retirement"): $4,200 of monthly spending in retirement and $2,000 of fixed retirement income per month ($24,000 a year, the pension total used in Section 4).
Open the calculator: Open the retirement planning calculator. Bookmark it and re-run it once a year with updated balances and pension estimates.
17. A Practical Retirement Planning Workflow
Use this order every time you revisit the plan, so you do not skip the step that matters most:
- 1. Update spending — last year's actual spending by category.
- 2. Update pension estimates — official estimates, not last year's guess.
- 3. Recompute the income gap — spending minus reliable pension.
- 4. Recompute the target range — gap ÷ 3%, 3.5%, and 4%.
- 5. Stress-test — one shock at a time, with a pre-committed adjustment.
- 6. Decide one action — save more, retire later, spend less, or rebalance. One action per review is enough.
18. Common Mistakes
- Using salary instead of spending as the target — the gap, not the salary, decides the portfolio.
- Mixing today's dollars with future dollars — pick nominal or real and stay consistent.
- Counting a home as monthly income — it is an asset, not a paycheck, unless you sell or borrow.
- Assuming a pension is inflation-adjusted — check the formula, not the headline.
- Trusting a single withdrawal rate — test 3%, 3.5%, and 4% and see the range.
- Ignoring taxes and fees — both compound against you for decades.
- Planning for average life expectancy — plan for the longer tail, especially as a couple.
- Buying a complex product to close a gap — first find why the gap exists (Section 29).
19. Frequently Asked Questions
How much do I need to retire? It depends on your spending minus your pension income. Use Section 4 to find your gap, then Section 8 to convert the gap into a target range. There is no single number that fits every household.
Is $1 million enough? For a household with a $20,000 annual gap and a 4% withdrawal assumption, $500,000 covers the gap. For a household with a $50,000 gap, $1 million is not enough at 4%. The gap decides, not the round number.
When should I claim Social Security? Compare monthly versus lifetime benefit (Section 22), health, household income, survivor benefits, and whether you can afford to wait. There is no single best age for every worker.
Should I pay off my mortgage before retiring? Compare the mortgage rate, the tax treatment, and the effect on monthly cash flow. A paid-off home lowers essential spending, which lowers the income gap — but it also locks cash into an illiquid asset. Decide with numbers, not slogans.
What if I have no pension? Then your portfolio must fund the full spending amount, not just a gap. The target will be larger, and flexible spending plus delayed retirement become more valuable levers.
Can I retire early? Test it as a scenario: earlier retirement means fewer contribution years, more withdrawal years, and a longer horizon. If the plan only works with optimistic returns, it is not ready.
How often should I review the plan? Once a year, plus after any major event: job change, move, marriage or divorce, health change, inheritance, or a large market fall (Section 27).
20. A Complete Worked Example: From Household Budget to Portfolio Target
The earlier examples introduced the main formulas separately. It is more useful to see how they work together in one household plan. The following fictional case is deliberately simple enough to follow, but detailed enough to show why a retirement target should be calculated rather than guessed.
Household: Maya and Daniel, ages 52 and 54, plan to retire at 67. Current savings: $420,000 combined. They will contribute $18,000 per year until retirement. Their expected lifestyle spending in today's dollars is $50,400 per year. Their expected combined pension income at 67 is $24,000 per year in today's dollars.
| Step | Calculation | Result |
|---|---|---|
| 1. Annual spending | Lifestyle budget | $50,400 / year |
| 2. Pension income | Public $18,000 + employer $6,000 | $24,000 / year |
| 3. Income gap | $50,400 − $24,000 | $26,400 / year |
| 4. Target at 4% | $26,400 ÷ 0.04 | $660,000 |
| 5. Target at 3.5% | $26,400 ÷ 0.035 | $754,000 |
| 6. Target at 3% | $26,400 ÷ 0.03 | $880,000 |
Assuming a 3% annual real return after inflation and fees, with the $18,000 contribution made at the end of each year, their current $420,000 plus future contributions would grow to approximately $897,900 after 13 years and $989,100 after 15 years, measured in today's purchasing power. These figures are projections under a constant-return assumption, not forecasts. Against the $660,000–$880,000 target range, the couple appears to have room to spare. However, the apparent margin can shrink if returns are lower, contributions stop, taxes or fees are higher than assumed, or the spending gap rises. They should test a weaker-return scenario and confirm that the pension figures are stated in the same real-dollar terms as the spending budget.
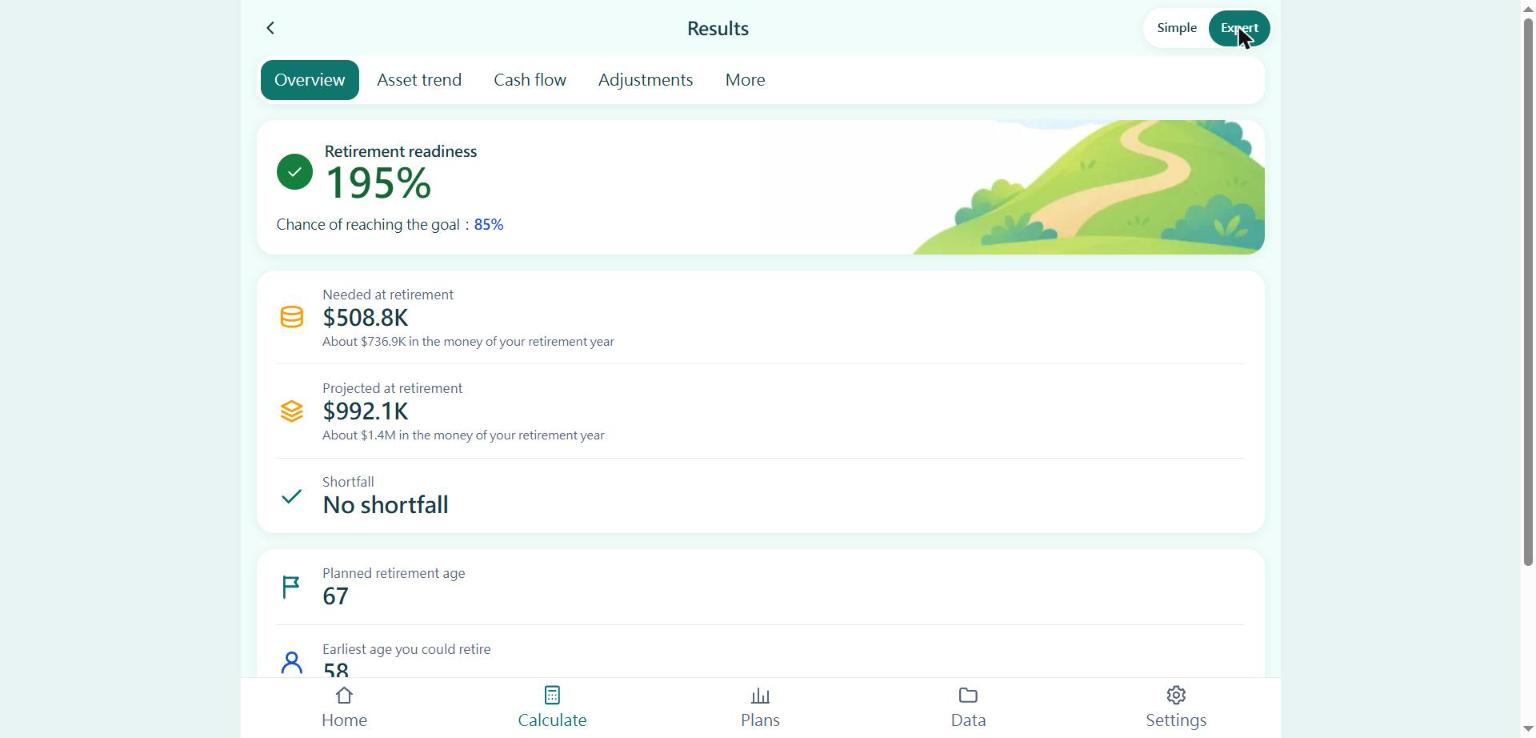
Screenshot 5 — Expert view, Overview tab, for the Maya and Daniel inputs. The tool projects about $992.1K at retirement (compare the $989,100 projection above) and reports no shortfall. Its "Needed at retirement" figure ($508.8K in today's money) is the amount the tool calculates is required to fund spending through the chosen life expectancy; it is not the simple gap ÷ withdrawal-rate shortcut, which gives $660,000 at 4%. Both are estimates, so compare their assumptions before relying on either.
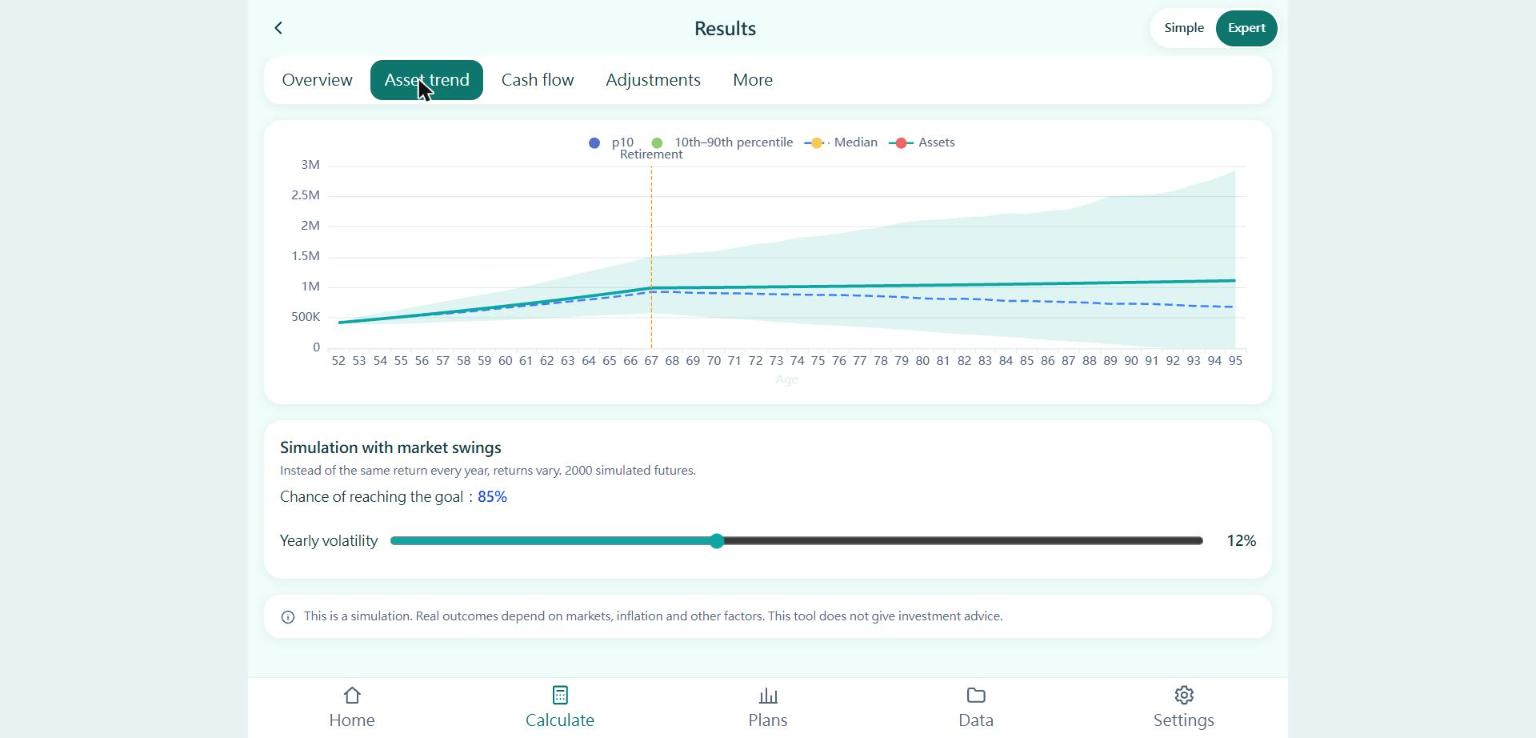
Screenshot 6 — Asset trend tab: the median and 10th–90th percentile range from 2,000 simulated market paths, with a reported 85% chance of reaching the goal at 12% yearly volatility.
20.1 How to Turn the Projection Into a Decision
A projection is useful only when it leads to a decision you can act on. Start by separating the result into three parts: the amount that appears secure under conservative assumptions, the amount that depends on investment returns, and the amount that depends on choices you can still change. This prevents a single projected balance from creating false confidence.
If the conservative scenario falls short, do not immediately assume that you must take more investment risk. First identify the largest driver of the shortfall. Is the spending estimate too high because it includes optional travel and purchases? Is the pension estimate based on an optimistic claiming age? Are fees reducing returns? Is the planned retirement date leaving too few contribution years? Each cause suggests a different response.
Next, choose one adjustment and measure its effect. For example, test a one-year delay in retirement, a modest increase in annual contributions, or a reduction in discretionary spending. Change one input at a time so you can see which adjustment has the greatest effect. If several changes are made together, keep a written record of each assumption; otherwise it becomes difficult to understand why the result improved.
Set a threshold for reviewing the plan again. You might revisit it when annual spending changes materially, when an official pension estimate is updated, when employment changes, or when a major market decline affects the portfolio. The threshold should trigger a review, not an automatic investment decision.
Finally, discuss the plan with anyone who shares the household's finances. Partners may have different expectations about retirement age, travel, housing, family support, or healthcare. A useful plan makes those differences visible early, when there is still time to adjust contributions, spending, or timing. The goal is not to force agreement on every detail; it is to make sure both people understand the trade-offs and the assumptions behind the target.
The lesson is not that Maya and Daniel are 'on track' or 'behind.' It is that they can see which lever — time, saving, spending, or pension timing — closes the remaining gap with the least pain, and they can choose it while they still have time.
21. Compare Retirement Ages: The Decision Is Bigger Than One More Year of Saving
Delaying retirement by two years does three things at once: two more years of contributions, two fewer years of withdrawals, and often a higher pension (because claiming later increases the monthly amount). That is why a two-year delay often moves the target more than a year of extra saving alone.
However, delaying retirement also has costs. You give up leisure time, may face health or caregiving constraints, and may not be able to continue working in the same role. A calculator can compare financial scenarios, but it cannot decide how much your time and health are worth. Compare the financial gain with the personal cost, and decide with both in view.
Test at least three ages: your earliest realistic age, your planned age, and two years later. For each, note the gap, the target, and the required savings rate. If the earliest age only works with optimistic returns, it is not a plan — it is a wish.
22. A Deeper Look at Social Security Claiming: Monthly Benefit Versus Lifetime Benefit
The break-even age is the point at which the cumulative payments from a later claiming date catch up with the cumulative payments from an earlier date. It is not a universal age. The result depends on the worker's actual benefit estimates, the months of delay, cost-of-living adjustments, taxes, investment returns on payments received earlier, and how long the person lives. Use your own SSA estimates to compare the options rather than relying on a rule-of-thumb age. A calculation that ignores survivor benefits may also miss an important part of a couple's decision.
For couples, survivor benefits can change the comparison. An eligible surviving spouse may receive a benefit based on the deceased worker's record, subject to Social Security rules; the survivor does not simply add both checks together. A higher-earning partner's decision to delay claiming may therefore affect the income available to the survivor. Check the household's actual estimates and eligibility before assuming that delaying will produce a particular survivor payment.
Do not decide on break-even alone. Add health, the need for income now, tax brackets, other income, and the survivor's situation. The best claiming age is the one that fits the household, not the one that wins a spreadsheet race.
23. Retirement Taxes: Why the Account Balance Is Not the Spendable Balance
A $500,000 Traditional IRA is not worth the same spendable amount as a $500,000 Roth IRA, because the Traditional IRA withdrawals are generally taxable and the Roth qualified withdrawals are generally tax-free. A $500,000 taxable brokerage account sits in between, with capital-gains treatment on growth and no required distributions.
The withdrawal sequence matters. Drawing from taxable accounts first, then tax-deferred, then tax-free — or the reverse — changes the tax bill, the taxation of Social Security benefits, and Medicare premium surcharges. There is no single best sequence for every household; the best sequence depends on your brackets, your account mix, and your pension income.
Model taxes in the calculator if it supports them, or estimate them separately: apply your expected marginal rate to tax-deferred withdrawals, apply capital-gains rates to taxable-account gains, and leave qualified Roth withdrawals at zero. Then recompute the gap with after-tax numbers. A plan that looks funded before taxes can be underfunded after them.
24. Investment Allocation: Match the Portfolio to the Job It Must Do
A retirement portfolio has three jobs: fund near-term spending, keep pace with inflation over decades, and survive bad markets without forced selling. A single allocation cannot do all three perfectly, so most households split the job: a cash reserve for 1–2 years of gap spending, a stable bond allocation for the next few years, and a growth allocation for the long horizon.
Avoid choosing an asset allocation solely because it produces the highest historical return in a chart. Historical returns do not reveal whether the household could tolerate the losses or continue with the plan during a 30% fall. The allocation you can hold through a bad market beats the allocation you abandon at the bottom.
Rebalance on a schedule, not on headlines. Review the allocation once a year, restore the target mix, and check that the cash reserve is still funded. If a market fall has already cut the portfolio, do not sell growth assets to fund spending — draw from the cash reserve first and let the growth allocation recover.
25. What a Retirement Calculator Should Show You
A calculator is most useful when it helps you understand the drivers of the result, not when it produces a single green or red signal without explanation. A useful calculator should make the following distinctions visible:
- Spending versus pension income — the gap, not just the total.
- Nominal versus real dollars — which one are you looking at?
- Withdrawal rate and horizon — what happens at 3%, 3.5%, and 4%? To age 90? To age 95?
- Taxes and fees — are they included, or must you add them?
- Stress tests — what happens if markets fall early, or inflation runs higher?
If a calculator hides these distinctions, use it only for a rough first pass, then do the manual checks in Sections 4, 8, and 15. A single number without its assumptions is not a plan.
25.1 How to use the calculator as a decision tool
Use the calculator to compare decisions, not to predict the future. Enter your baseline, save it, then change one variable and save that as a second scenario. Compare the two side by side and ask: which assumption, if wrong, hurts most? That assumption is the one to verify with official sources.
25.2 What the calculator cannot decide
These limitations also apply when comparing advanced scenarios: a simulation is only as useful as its inputs and assumptions. Review the assumptions shown by the tool, and verify country-specific pension, tax, and healthcare rules with the relevant authorities.
25.3 Apply the workflow in the retirement planning calculator
You can use the online retirement planning calculator to turn the framework in this article into a set of scenarios. Start with the basic inputs: your current age, planned retirement age, current assets, expected contributions, retirement spending, inflation, and investment assumptions. Choose your planning country explicitly: the screens show only the rules that apply to the selected country, and that setting is independent of the interface language. Changing the display language does not, by itself, make US pension or tax rules applicable to another country.
Open the calculator and begin with a simple baseline. You do not need to solve every retirement question in one session. The most valuable first result is often the gap between your expected spending and your estimated reliable income. Once that gap is visible, you can decide which assumption to investigate next.
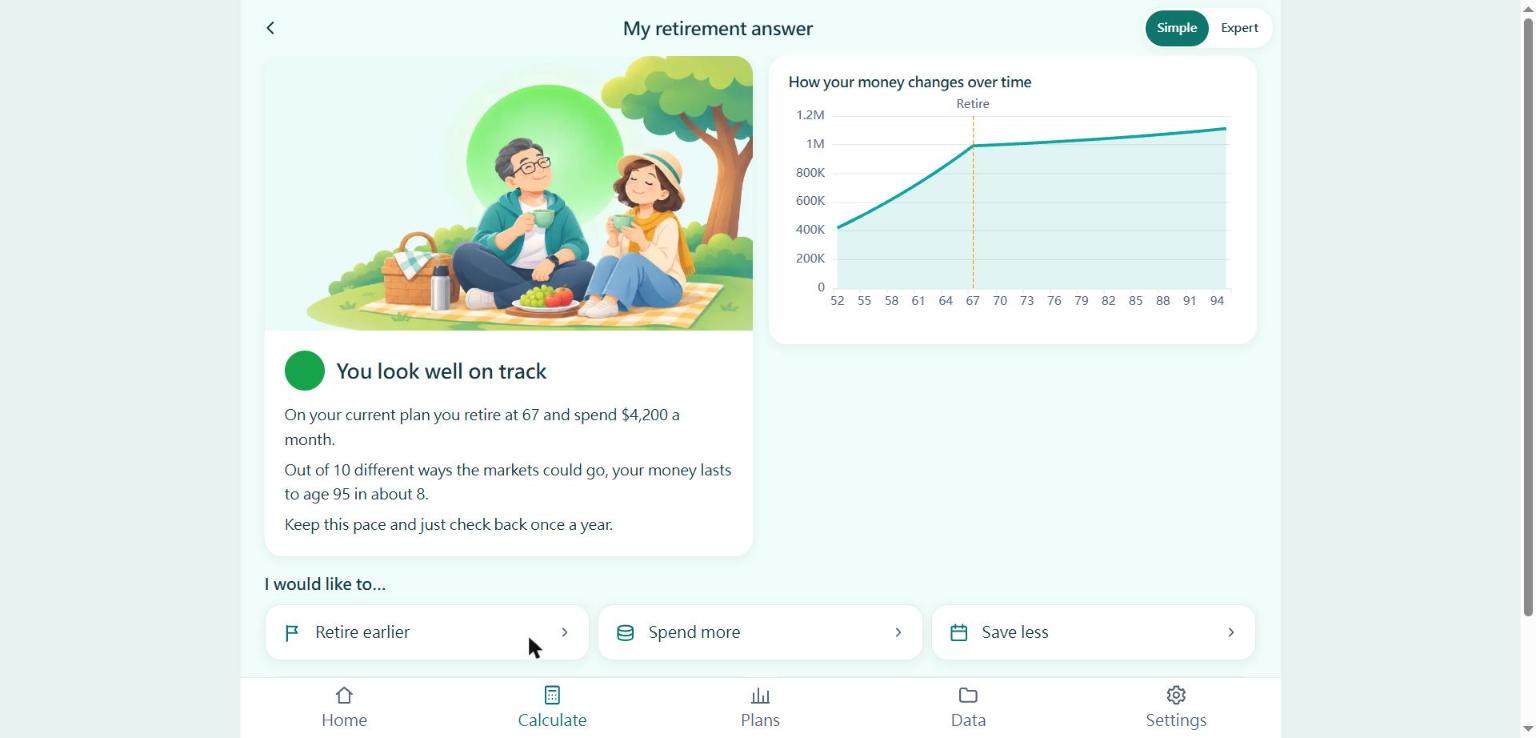
Screenshot 7 — Simple view of the same plan: "Out of 10 different ways the markets could go, your money lasts to age 95 in about 8." Results are estimates, not predictions.
Open the calculator: Open the retirement planning calculator
26. A Global Reader's Country-Check Worksheet
If you are reading this outside the United States, use the following checklist before treating any US example as relevant to your situation:
- Public pension: what is the official name, eligibility age, and estimated amount in my country?
- Employer pension: defined benefit or defined contribution? What are the vesting and payout rules?
- Tax: how are pension income, retirement-account withdrawals, and capital gains taxed where I live?
- Healthcare: what coverage will I have in retirement, and what does it cost per month?
- Currency: will I earn, save, and spend in the same currency? If not, what is my currency buffer?
- Residency: if I retire abroad, how do pension, tax, healthcare, and residency rules change?
Answer these six questions with official sources before you rely on any US-based example. The framework in this guide — spending, pension, gap, target, stress test — works in every country. The numbers do not transfer automatically.
27. Turn the Plan Into an Annual Review Routine
A retirement plan is not a one-time calculation. Set a single annual review date and repeat the workflow in Section 17. Update spending from actual statements, update pension estimates from official sources, recompute the gap and target, run one stress test, and decide one action. One hour a year is enough to keep the plan honest.
Trigger an earlier review after any major event: job change, move, marriage or divorce, health change, inheritance, a large market fall, or a change in pension or tax law. Do not wait for the annual date if the facts have changed.
Keep it going: re-run the calculator on your review date each year.
28. The Questions to Answer Before You Leave Work
- What are my essential annual expenses in today's dollars?
- What is my expected lifestyle budget, including irregular expenses?
- Which pension payments are based on official estimates, and which are uncertain?
- When can each pension begin, and how does the amount change if I wait?
- What healthcare coverage will I have immediately after leaving work?
- How will I pay for healthcare and long-term care costs that are not covered?
- How much of my portfolio is in tax-deferred, tax-free, and taxable accounts?
- What is my planned withdrawal method?
- What will I do if markets fall sharply during the first years of retirement?
- Which expenses can I reduce without compromising essential needs?
- How long does the plan last under a longer-life scenario?
- What will happen to household income if one partner dies first?
- If I retire in another country, what are the pension, tax, healthcare, and currency implications?
- When will I review the plan again, and what events would trigger an earlier review?
If you cannot answer several of these questions, that does not mean you must abandon the retirement goal. It means there is still important information to collect before relying on the projected result. Collect it now, while you still have time to adjust.
29. Annuities, Debt, and the Order of Financial Priorities
An annuity can convert some of your savings into a stream of payments, sometimes for life. This can reduce the risk of outliving that portion of your assets, but it does not automatically make an annuity the right choice.
Before considering an annuity, understand exactly what the contract promises. Is the payment fixed or inflation-adjusted? Does it continue for one life or two? Is there a guarantee period? What happens if the annuitant dies early? Can the contract be changed or surrendered, and at what cost? If you cannot answer these questions in plain language, do not sign.
A fixed nominal payment may lose purchasing power over a long retirement. An inflation-linked option may begin with a lower payment or have different pricing. Joint-life coverage may protect a surviving spouse but may also reduce the initial payment. Compare the annuity not with a stock-market return, but with the cost of funding the same essential spending from a portfolio with a conservative withdrawal rate.
An annuity can be considered alongside a diversified investment portfolio. Some households may use guaranteed income to cover a portion of essential expenses while keeping other assets invested for flexibility, inflation protection, and discretionary spending.
Debt also deserves attention before retirement. High-interest consumer debt can make a retirement budget fragile because required repayments continue regardless of market performance. Paying down expensive debt before retirement may improve cash flow more reliably than chasing higher investment returns.
A useful pre-retirement balance sheet should therefore list cash reserves, investment accounts, pension rights, property, debt, insurance, and large expected expenses. Do not treat all assets as equally liquid or all debts as equally urgent.
If you have several years before retirement, prioritize building a sustainable savings habit, reviewing employer matching contributions where available, controlling high-interest debt, and understanding your pension entitlements. If retirement is near, prioritize verifying pension and healthcare numbers and funding a cash reserve.
Finally, do not purchase a complex financial product solely because a projection shows a shortfall. First understand why the gap exists. It may be caused by an overly high spending assumption, missing pension information, an unrealistic return assumption, or a withdrawal method that does not fit your essential spending. Fix the cause, then choose the product — if you still need one.
30. Final Perspective: Build a Plan You Can Adjust
The most useful retirement plan is not the one with the most optimistic projection. It is the one that makes its assumptions visible, identifies the risks that matter, and gives you practical choices when circumstances change.
A retirement target should connect your lifestyle budget, pension income, investment assets, taxes, healthcare, inflation, and withdrawal strategy. If one of these elements is missing, the final number may look precise while hiding a major risk.
Use official pension and tax sources for country-specific facts. Use conservative assumptions when an income source is uncertain. Separate essential expenses from discretionary spending. Test more than one retirement age and more than one withdrawal rate. Stress-test the plan before you need it, not after.
A calculator can help organize these decisions and compare scenarios. Its value is not that it predicts the future. Its value is that it lets you see how a different retirement age, contribution amount, pension estimate, inflation assumption, or withdrawal method changes the plan.
The goal is not to find a magic number that removes every risk. The goal is to understand what your retirement may require, what resources you can reasonably expect, where the gaps are, and which adjustments remain available while you still have time to make them.
Your next step — today: 1) Write your three budgets. 2) Subtract your pension to find your gap. 3) Open the calculator and test your gap at 3%, 3.5%, and 4%. Open the retirement planning calculator
Share this guide: If this guide helped you identify a question you had not considered, share it with a partner or family member who is also planning for retirement. Comparing assumptions together can reveal differences in spending expectations, pension timing, and healthcare needs before they become difficult decisions. Send it to one person who is planning to retire in the next 10 years.
Important note: This article is for educational purposes only. Retirement projections are estimates based on assumptions and are not guarantees of future investment performance or retirement income. Pension eligibility, tax treatment, healthcare coverage, and retirement account rules vary by country and individual circumstances. Verify current rules with relevant government agencies and qualified professionals before making financial decisions. Disclosure: Time Traveler Lab operates the free retirement planning calculator linked in this guide. This article contains no affiliate or paid links.
Further Reading
For country-specific rules, use the official agency responsible for your pension, tax, and healthcare system. The following sources support the United States examples and the withdrawal-rate discussion in this guide:
Sources and notes
US figures from the Social Security Administration, IRS (2026 contribution limits), CMS and Medicare.gov; withdrawal-rate discussion informed by Morningstar and OECD research. Chart images were generated for illustration; calculator screenshots were captured from the live Retirement Planner tool. Full list under Further Reading.
Comments (0)
No comments yet.
Comments are published first and reviewed afterwards; rule-breaking comments are hidden. Only signed-in members can comment.